
Eventbrite URL: https://www.eventbrite.com/e/data-visualization-using-power-bi-tickets-38712899324
Eto na ata an pinaka fulfilling workshop na nagawa ko sa talambuhay ko. I taught them the basics and then gave them space for creativity, binigyan ko sila ng mapapagkunan ng data na gusto nilang paglaruan, and then Boom !! ayan! nakagawa sila ng sarili nilang PowerBI Reports. Nung nag lalaboy laboy ako sa room, madami akong nakikita mga makukulay at mga nagtangkang gumamit ng custom visuals. I’m quite sure that they were able to publish it on their free PowerBI Account. Pero etong tatlo lang ang brave enough to share they discoveries with the class.
Number of High-school Provincial Enrollment by Gender from Chriselle Molar: 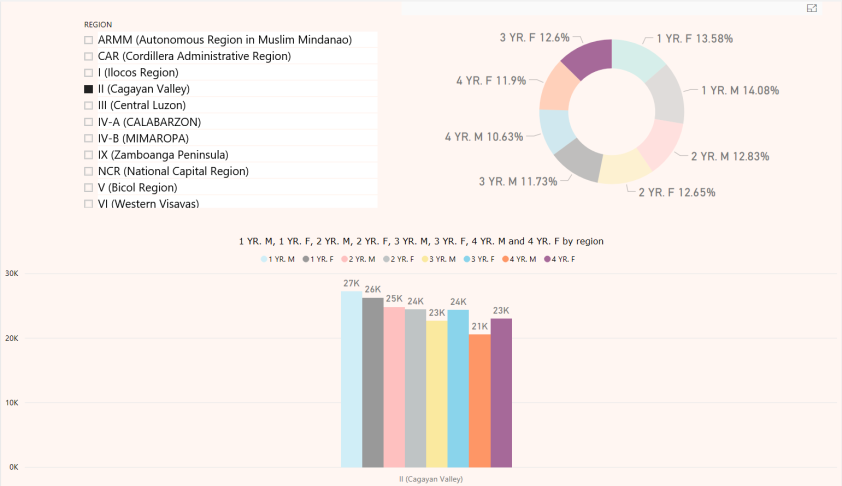
Imports of the Department of Health from Daryl Nicolas: 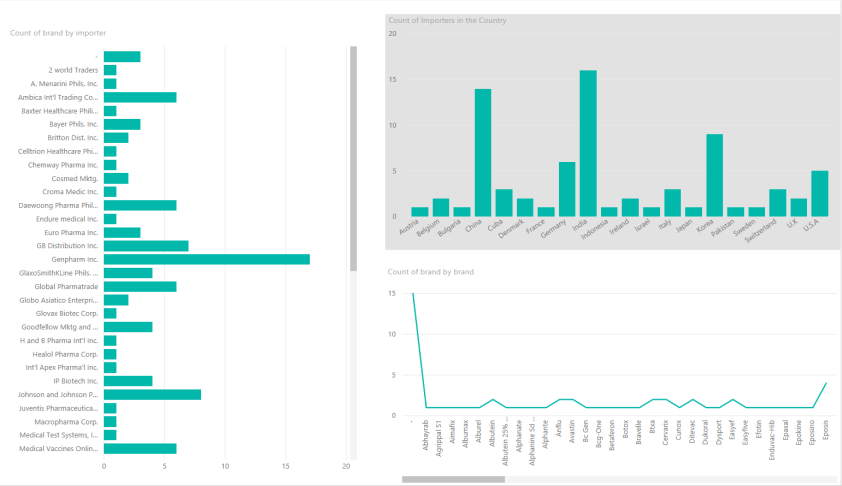
Philippine Provincial Election Results of 2016 from some random computer science student: 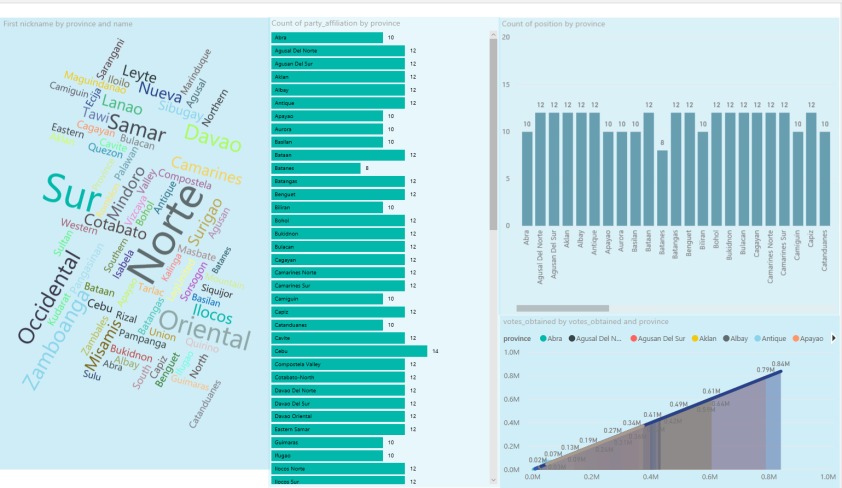
Not bad for students with zero knowledge on Business Intelligence and the Context of the Data. I enjoyed their report and given them a little something in return for sharing what they’ve learned form that day. I’ll try to add a few posts regarding on how they could further improve their PowerBI Reports so stay tuned.
I would like to commend the efforts of those people behind the Open Data Philippines more power to you guys and hopefully more updated data para mas happy kaming mga data professionals.
